
Iran, Oil, and Markets
- Michael Livian, CFA

- Mar 18
- 8 min read
Updated: Mar 19

The following article is a data-driven analysis of current risks. It is not a prediction. Markets are functioning normally, and we are not seeing stress signals in credit or equity markets yet. Portfolios are currently stable. Our job is to prepare, not react.
The Conflict Has Left the Realm of Theoretical Scenarios
For weeks, analysts debated how escalation between the United States and Iran might unfold. That debate is now behind us. Joint US-Israeli airstrikes began on February 28, 2026. By March 4, Iranian forces declared the Strait of Hormuz closed to commercial shipping, carrying out attacks on vessels attempting transit. The IEA estimates the war is cutting global oil supply by approximately 8 million barrels per day in March, accounting for the near closure of the strait and the industry's efforts to route around the problem. Brent crude has surged more than 50% from its pre-conflict levels, US gasoline prices have risen 74 cents per gallon since the war began, and IEA member countries have agreed to release 400 million barrels from strategic petroleum reserves, the largest emergency release in history. The key question now is how deep and how persistent the impact may be.
Lessons from Previous Oil Shocks
Three historical episodes help calibrate the current moment.
The Suez crisis of 1956 disrupted the main shipping route for oil flowing to Europe after Egypt nationalized the canal. Tankers were forced to sail around Africa, adding roughly 6,000 nautical miles to each voyage. Prices rose but markets stabilized within about a year as supply adjustments took hold.
The 1973 oil embargo delivered the most severe energy shock in modern economic history. Oil prices rose from roughly $3 per barrel in 1973 to more than $12 per barrel in 1974, a fourfold increase. Energy expenditures as a share of US GDP nearly doubled, contributing to inflation exceeding 12 percent and a prolonged economic contraction.
The 1990 Gulf War removed roughly 4 to 5 million barrels per day from global supply following Iraq's invasion of Kuwait. Prices doubled from around $20 to nearly $40 per barrel before falling back once coalition forces secured the region's oil infrastructure.
These episodes illustrate a crucial distinction for the current situation. The 1973 shock was a deliberate political restriction of supply; producers chose not to sell. The 1990 shock was a production disruption; oil fields went offline. The current conflict is a logistics disruption, one with a specific and identifiable choke point. This matters because logistics disruptions can, in theory, be resolved more quickly if the military balance shifts. They can also escalate sharply if an adversary has the means to sustain them.
The Strait of Hormuz: Why This Chokepoint Is Different
Roughly 27% of the world's maritime trade in crude oil and petroleum products transits through the Strait of Hormuz, and Iran has the capacity, via mines, speed boats, submarines, shore-based cruise missiles, and other systems, to disrupt the flow of commercial shipping into and out of the Persian Gulf. The distinction between Iranian tactics matters enormously for energy markets. Missile strikes on military targets create headlines but do not directly remove barrels from global supply. Naval mines are different in kind, not just degree. Mines do not require Iran to engage US warships directly; they simply make the strait economically impassable for commercial shipping captains and their insurers. More than a dozen vessels have been struck in the strait since the start of the conflict, and Iran has been laying mines along the route. War risk insurance has increased dramatically, and even vessels not directly threatened are avoiding the waterway.
The US Navy may be able to escort tankers through the strait, but Energy Secretary Christopher Wright indicated that even with government assistance for insurance, oil traffic would not return to normal. The mining campaign buys Iran time and raises the cost of resolution even if Iranian surface forces are degraded.
Today’s Structural Resilience
The global economy is meaningfully more resilient to oil shocks than it was in the 1970s. Energy intensity has fallen dramatically. The United States now consumes roughly 0.4 barrels of oil per $1,000 of GDP, compared to approximately 1 barrel per $1,000 in the early 1970s. Domestic US production has risen to approximately 13.2 million barrels per day, making higher oil prices a domestic income redistribution rather than a pure wealth transfer abroad. These structural improvements are real but insufficient to fully absorb the current shock. The reason is that the Hormuz disruption is not just an oil story.
Gulf states produce nearly 49% of global urea exports and 30% of global ammonia exports, and around a third of the world's urea transits through the Strait. Urea prices have already risen 35% since the strikes began on February 28. A prolonged closure affects fertilizer costs, which flow into food prices globally, particularly in emerging markets, with a lag of one to two growing seasons. This is a second-order inflationary channel that standard oil shock models do not capture.
The geographic asymmetry in natural gas is also significant. European natural gas prices surged approximately 63% in the week following the start of operations, while US prices rose only about 7%, a reflection of the fact that US LNG infrastructure is more insulated from Middle East logistics. This divergence has meaningful implications for European industrial competitiveness and monetary policy.
Three Paths Forward
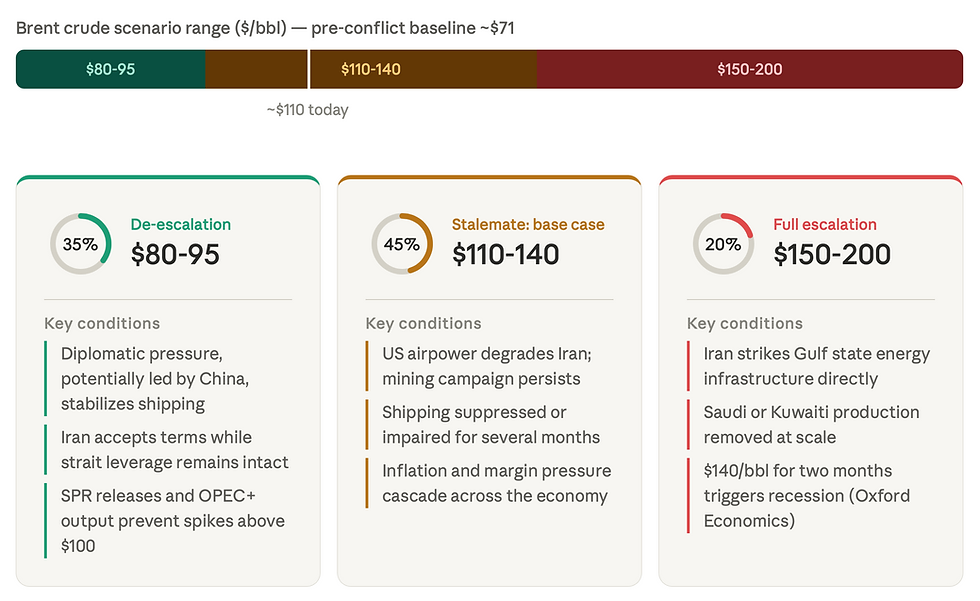
The first scenario (35% probability, in our opinion) is rapid de-escalation. Diplomatic pressure, potentially involving China, which relies heavily on Gulf oil, stabilizes the situation and commercial shipping resumes within weeks. SPR releases and OPEC+ output increases prevent sustained price spikes above $100 per barrel. Global growth slows modestly. This scenario has not closed, but the window is narrowing. It requires Iran to accept terms under military pressure while its leverage, control of the strait, remains intact. That is a difficult negotiating position to abandon quickly.
The second scenario (45% probability), and currently the most probable, is a prolonged military stalemate. US airpower continues to degrade Iranian military infrastructure while Iran sustains sufficient mine-laying and harassment capability to keep commercial shipping suppressed or significantly impaired. Oil prices remain structurally elevated, and it is not clear when a military breakthrough might change the supply picture. In this environment, oil trading in the $110 to $140 range for several months is plausible, with cascading effects on inflation, central bank policy, and corporate margins.
The third scenario (20% probability), full-scale escalation, involves direct Iranian attacks on Gulf state energy infrastructure. Iran has indicated it would strike US-linked oil and natural gas infrastructure, and debris from an intercepted Iranian drone already fell on a key UAE oil terminal. Removal of Saudi or Kuwaiti production at scale, combined with Hormuz closure, could push oil to $150 to $200 per barrel. Oxford Economics estimates that oil averaging around $140 per barrel for two months would be sufficient to push parts of the global economy into mild recession. In a more extreme scenario, oil could move materially higher, increasing recession risk.
Our Investment Playbook
The current war has the potential to go in many directions that no professional can predict. One possibility is that multiple inflation channels are activated while hurting economic growth (stagflation). These economic reactions tend to unfold gradually, not all at once.
History offers some guidance for navigating oil-driven stagflation environments, though it is not a single trade, it is a sequence. In most oil shocks, energy producers and commodity-related investments performed strongly in the initial phase of a supply shock, as prices surged and earnings followed. But that outperformance has a shelf life. As elevated energy costs work their way through the economy, demand eventually breaks and when it does, the rotation is swift.
Energy and commodity positions that led the spike phase can give back gains quickly as recession risk rises and demand destruction takes hold. The more durable winners across the full cycle were high-quality businesses with genuine pricing power and growing dividends, and income-producing real assets (farmland, infrastructure, and well-capitalized REITs) that could pass inflation through to rents and revenues while offering defensible cash flows. Short-duration, high-quality fixed income served as the bridge between phases, preserving capital and optionality while longer-duration bonds suffered. The consistent losers throughout were long nominal sovereign bonds, energy-intensive cyclicals, and heavily levered rate-sensitive sectors.
We are tracking current conditions against that possible two-phase template closely. For now, equity market technicals and internals remain constructive, and credit and interest rate markets have not flashed the kind of stress signals that historically precede a broader deterioration. We are monitoring both carefully, alongside developments in the Strait of Hormuz and the average price of oil. Should the conflict linger and oil sustain a level above $100 per barrel for more than a few weeks, we will begin partially repositioning portfolios in stages.
Phase one, the spike: increase exposure to:
Energy producers and infrastructure, with a focus on low-cost US and Canadian operators
Gold and a modest precious metals sleeve, sized as a geopolitical and inflation hedge
Select real assets with proven inflation pass-through, including energy and transport infrastructure and REITs with strong pricing power and low leverage
Short-duration, high-quality bonds and T-bills, which preserve optionality and limit damage from rising yields
Phase two, the rotation: as demand destruction signals emerge, shift toward:
High-quality dividend growers with genuine pricing power, strong balance sheets, and high returns on invested capital
Income-producing real assets (infrastructure, farmland, and well-capitalized REITs) with durable, inflation-linked cash flows
Reduce or eliminate throughout:
Long-duration nominal sovereign bonds, which suffered the worst real losses in 1970s stagflation
Energy-intensive cyclicals, including airlines, chemicals, shipping, and low-margin industrials
Heavily levered, rate-sensitive positions in real estate and lower-quality credit
Eurozone and Japan and Asian cyclicals, which face the same margin squeeze from high energy and LNG costs.

We will not front-run a scenario that has not yet materialized, but we will not wait for it to be obvious before acting.
What History Tells Us About the Conflict Resolution
Every major oil shock of the past half century resolved eventually. What history does not tell us is how long "eventually" takes, or what the economy looks like at the other end of the disruption. The 1973 embargo lasted five months before Arab oil producers lifted it, and its inflationary effects persisted for years. The 1990 Gulf War was resolved in weeks but required the full mobilization of a US-led coalition and unambiguous military victory.
The current conflict has features of both. Iran is not a conventional adversary that can be defeated by airstrikes alone, and its control of the strait's northern shoreline gives it leverage that does not disappear with its air defenses. At the same time, the economic pressure on Tehran is real. Iran's own fiscal breakeven oil price is around $80 per barrel, and sanctions-constrained export revenues compound the strain.
The most honest assessment for investors is this: the probability of a clean, rapid resolution has declined since February 28. The scenario that deserves the most weight now is not catastrophic collapse, but prolonged friction. Weeks turning into months, strategic petroleum reserves drawn down faster than they can be replenished, and energy security returning to the center of geopolitical and portfolio strategy for the first time in a generation.
Conclusions
First, it is important to note that even in severe oil shocks, markets always adjusted and portfolios recovered over time. Importantly, current market conditions do not yet reflect the kind of stress that typically precedes major drawdowns.
What does this mean for your portfolio today?
No immediate changes required
Our strategies continue to function normally
Diversification is working as intended
We have liquidity and flexibility if conditions change
Our action plan is the following:
If oil stays below $100 → no changes
If oil remains above $100 for several weeks → gradual adjustments
If stress appears in equity/credit markets → more defensive positioning
We are not trying to predict outcomes. We follow a disciplined process tied to observable data such as oil prices and equity/credit indicators. We will act gradually if conditions warrant.
Sources:
US Energy Information Administration (EIA), Short-Term Energy Outlook, March 2026
International Energy Agency (IEA), Emergency Reserve Release Statement, March 2026
Congressional Research Service, Iran Conflict and the Strait of Hormuz: Impacts on Oil, Gas, and Other Commodities, March 2026
Oxford Economics, Iran War Scenarios, March 2026
Loomis Sayles, Oil's Rocky Road Ahead, November 2025
Daniel Yergin, The Prize: The Epic Quest for Oil, Money and Power, 1991
Federal Reserve Economic Database (FRED)
VERY USEFUL ! ..... under scenario # 3 my principle exposure are below inv. grade corporate credits -- about 10 % of my portfolio total --- Thank you, Michael
VE RY USEFUL ! ......... under scenario # 3 my priciple exposure are below inv. grade corporate credits -- about 10% of my portfolio total ----- Tnak you, Michael